Infographics are one of the best ways to present data without making your audience yawn with boredom. There are a lot of people who have impressive data, but what they don’t know is how to create informative and well-designed infographics.
Fortunately, there are many infographic tools that will help you create vivid charts and graphs within minutes and without much effort. Check out our list of over 40 infographic tools and create awesome infographics in no time.
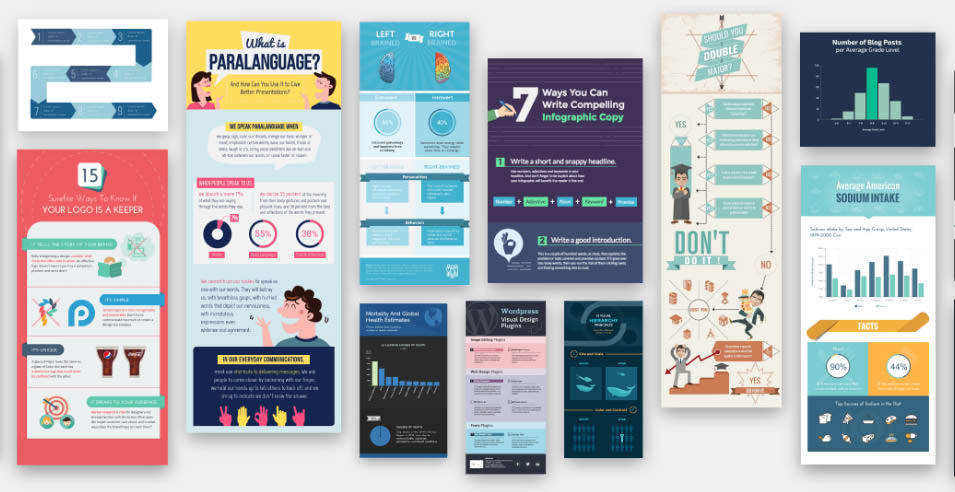
40 Free Infographic Templates to Download
40 Free Infographic Templates to Download
Infographics are extremely popular these days. They help readers understand and remember huge chunks of information in a…Read more
Crello Infographic Maker
Crello is a perfect tool for infographic creation. It offers a massive library of professional templates and numerous editing tools for their customization. You can design infographics of different types, including interactive ones, and download them in preferable formats. Also, feel free to upload visuals to Crello’s editor and invite others to create infographics in a team.

Canva
Canva offers handy tools for designers, including an infographic tool. There are hundreds of templates and over a million stock images available, and you can even upload your own images.

Piktochart
Piktochart has one of the best tools to create interactive charts and maps. You can use animated charts using icons, text frames, themes and your own photos and videos.

Visme
Visme’s infographic tools section lets you create interactive infographics using charts, widgets, shapes and icons. There are handy pop-ups and animation features available to make your infographic beautiful.
Infogr.am
Infogr.am makes it easy to upload your data using different methods, including the ability to connect to a live data source. You can use over 35 chart templates to create stunning infographics.

Venngage
You can find hundreds of free and paid infographic templates at Venngage. They also have handy tutorials to get you started.

Cacoo
Cacoo is a comprehensive diagram tool that allows you to create interactive Flowcharts, UML Diagrams, Network Diagrams, and Wireframes.

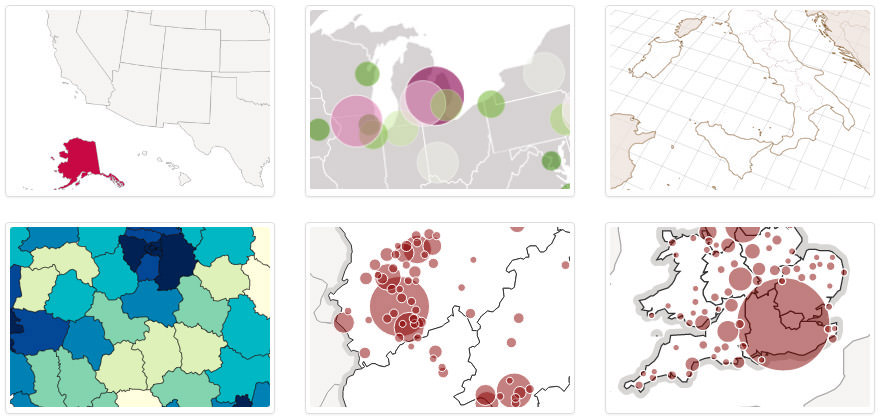
Kartograph.org
Kartograph is a great free tool to create illustrative and interactive maps. It has Python and JavaScript based tools to create the required maps.
Kinzaa
Kinzaa has a handy wizard to help you create infographic resumes and interactive landing pages for websites.

Adioma
Adioma is a smart infographics tool that automatically creates interactive infographics based on data provided. It has a smart AI that learns from your usage.

Graphs.net
At Graphs.net, artists upload their own infographics to let others use them for free. You can browse graphs by type, category or popularity.

Google Data Studio
Google offers this handy data visualization tool to create engaging dashboards and reports using charts and graphs. It also offers the users to extract data from other Google services, such as Google AdSense.

Visually
Visually doesn’t offer any infographic tools itself, instead, it connects you with leading designers to get direct help with infographics at an affordable price.

Easel.ly
Easel.ly has almost a million free stock images and infographic templates to help you create infographics for free. You can even get help from their designers or access webinars to get inspiration.

Vizydrop
Vizydrop is a free automatic data visualization tool that will suggest interactive charts based on your data type and automatically input the data. You can import data from different sources and Vizydrop gives full control over data customization.

ArcGIS Infographics Add-on
This is actually an extension of the desktop-based interactive map creation tool ArcGIS. The extension allows you to add infographics right on the maps to help anyone easily follow them.

Edraw
Edraw is an infographic application for Windows and Mac that lets you create cool charts and maps. It is fully customizable and has drawing tools as well to take full control.

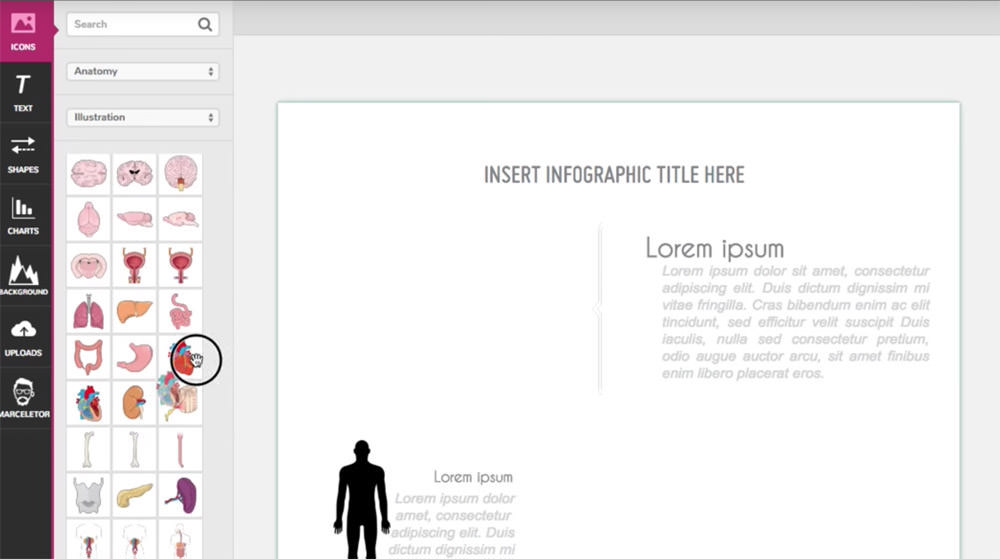
Mind the Graph
Mind the Graph offers scientific illustration tools for classes and projects including science related images, graphs, and charts. You can either create infographics yourself or ask for on-demand help.
Creately
Creately is a diagram creation tool that has handy features to quickly create over 50 different types of diagrams. You can also collaborate with other team members to create the perfect illustrations.

Icograms
Icograms is still in its beta stage, but it has some really advanced infographic creation tools. You can create diagrams, maps, and charts using built-in templates and icons, or your own images. The infographics are also pixel perfect with pixel grid in mind.

Icon Archive
Icons play an important role in the creation of an infographic and Icon Archive has one of the biggest archives of icons. You can find both free and paid icons here.

Medialoot
Medialoot offers plethora of tools for designers that you can either download separately or access all with the monthly subscription. There are hundreds of icons, fonts, mockups, and graphics tools available.

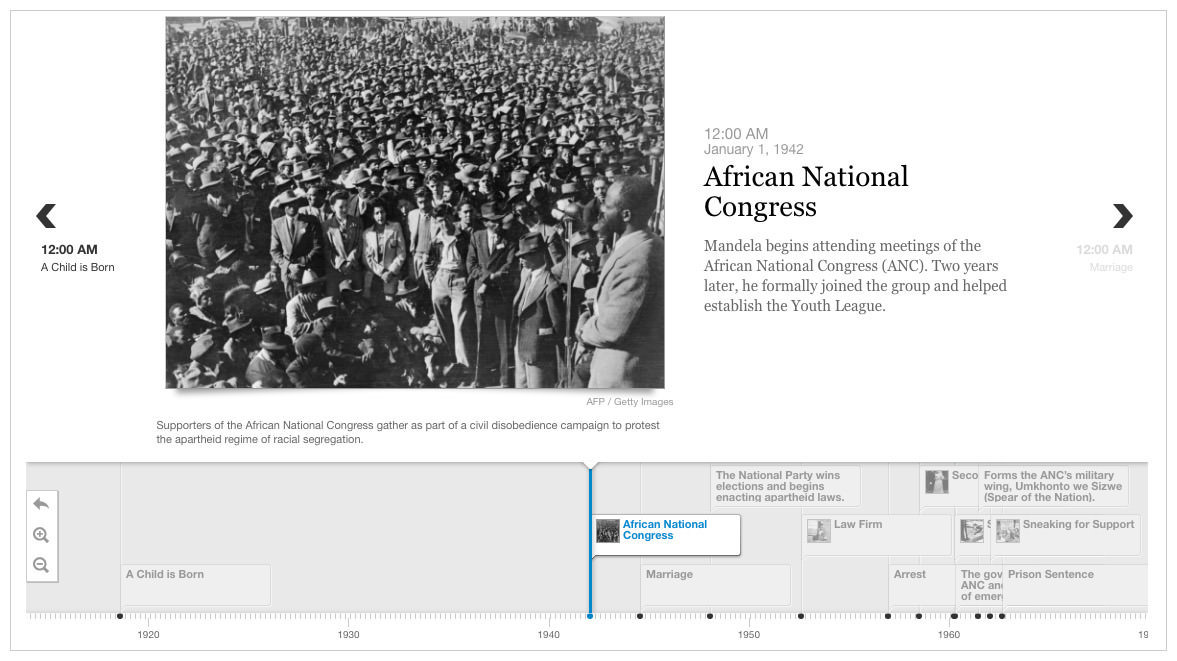
Timeline JS
An open-source and easy-to-use tool, TimelineJS enables you to create interactive and aesthetically powerful timelines by using Google spreadsheet only. With this tool you can create cool infographics related to events and occurances in chronological order.
Peecheey
You can find a number of vector art here on Peecheey that is available for download for free. There are many types of vector art available catering to different industries.

More Infographic Tools
Here are more tools that might come in handy when creating infographics.
- Tagxedo – Tagxedo is an automatic word cloud creator that offers you multiple features (themes and fonts) to present your data in the form of interesting word clouds.
- StatPlanet – Present your data through interactive graphs and maps with StatPlanet. It automatically creates infographics using maps, time period, graphs and charts when you import the data.
- Gliffy – Gliffy offers you to make flowcharts, Venn diagrams, mind maps, org charts, network diagrams, wireframes, technical drawings that you can collaborate with your team online.
- Charte.ca – Chart are integral parts of infographics, that you can easily create with Charte.ca. You can use animations and in-depth navigation tools to create the perfect interactive charts.